Question 2
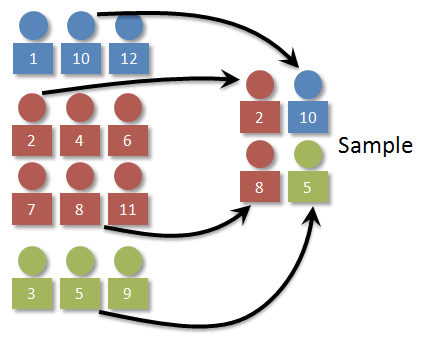
Simple Random Sampling
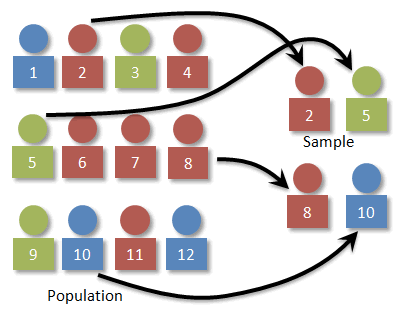
Stratified Sampling
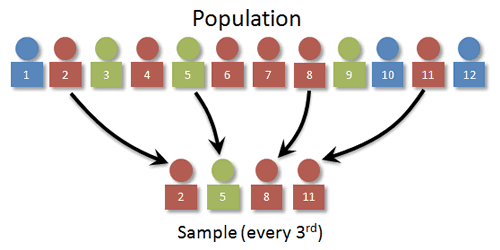
Systematic Sampling
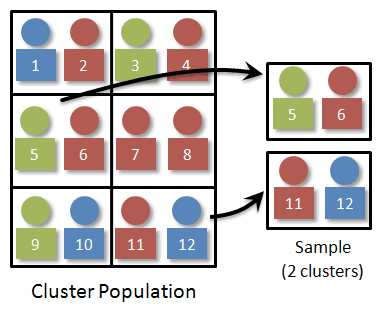
Cluster Sampling
Question 6
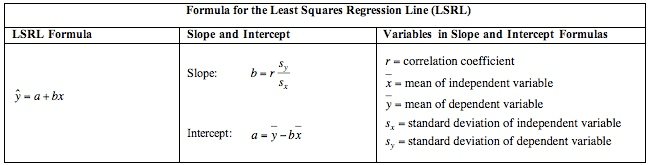
Question 14
-1 < r < 1
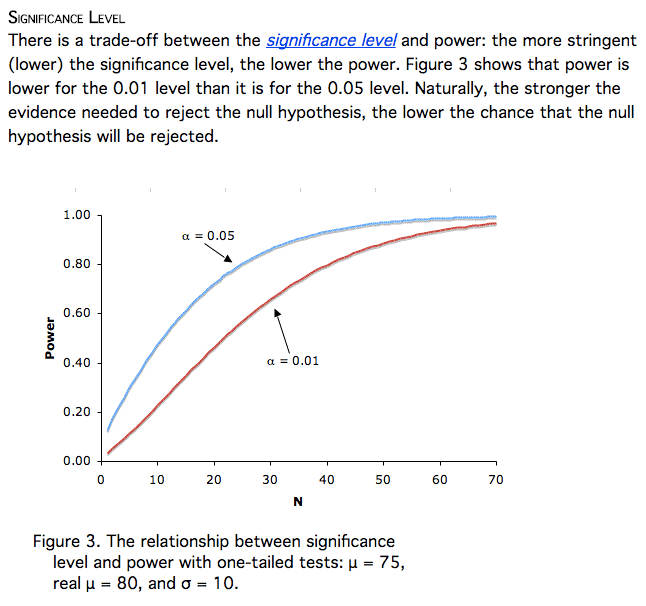
Question 15
The power of a test is affected by sample size (bigger sample, more power) and alpha level (larger alpha, i.e. .05 compared to .01, more power)
Question 18
![the width of a confidence interval is dependent on the z (or t)\*
and the standard deviation of the statistic. Assuming the z\* is
unchanged, the question is which is the smaller standard deviation
sqrt(.7\* .3/50) is approximately 00648 while
sqrt(\[37/60\*23/60\]/60) is approximately 0.0628 so the confidence
interval based on 37 out of 60 will be slightly narrower than the
confidence Interval based on 35 out of 50](media/image314.png)